
A React app rarely becomes slow because of one terrible decision.
More often, performance problems come from many small things: too much JavaScript, large images, unnecessary renders, expensive calculations, huge lists, slow network requests, or work happening on the main thread.
The good news is that most of these problems are measurable and fixable.
In this guide, you'll learn 12 practical React performance optimization techniques, from Core Web Vitals and code splitting to list virtualization, image optimization, Web Workers, prefetching, and real-device testing.
The most important rule throughout this guide is simple:
Measure first, optimize second.
1. Start With Core Web Vitals
Before changing your React code, find out where the actual performance problem is.
Core Web Vitals give you three important signals about the user experience:
LCP (Largest Contentful Paint): How quickly the main content becomes visible.
INP (Interaction to Next Paint): How responsive the page is when users interact with it.
CLS (Cumulative Layout Shift): How much the page unexpectedly moves while loading.
For example, imagine your homepage looks fast when you test it on a powerful development machine. But users on slower phones experience a delayed interaction after clicking a button.
Your local test may look fine while real users experience poor INP.
What to measure
Use tools such as:
Chrome DevTools
Lighthouse
PageSpeed Insights
Chrome's Performance panel
Real-user monitoring (RUM)
Don't immediately start adding useMemo, changing components, or rewriting your application.
First ask:
What exactly is slow?
If LCP is poor, investigate loading and rendering.
If INP is poor, investigate JavaScript execution and event handlers.
If CLS is poor, investigate layout shifts, images, fonts, and dynamically inserted content.
2. Use Code Splitting to Ship Less JavaScript
One of the easiest ways to make a large React application faster is to avoid sending the entire application to the browser at once.
Imagine an application has these routes:
/
 /dashboard
 /settings
 /analytics
 /admin
 /profile
A user visiting /profile doesn't necessarily need the JavaScript required for /analytics or /admin.
Code splitting lets you divide your JavaScript into smaller chunks and load them when they're needed.
With React, lazy() and Suspense provide a simple way to split components:
import { lazy, Suspense } from "react";
const Dashboard = lazy(() => import("./Dashboard"));
function App() {
  return (
    <Suspense fallback={<p>Loading...</p>}>
      <Dashboard />
    </Suspense>
  );
}
Now the Dashboard component can be loaded separately instead of being included in the initial JavaScript bundle.
Where should you split?
Route-level splitting is usually a good starting point.
For example:
Initial bundle
     ↓
Home page
     ↓
User clicks Dashboard
     ↓
Download dashboard chunk
Instead of:
Initial bundle
     ↓
Home + Dashboard + Admin + Settings + Analytics
Practical rule
Load what the user needs now. Load everything else later.
Don't blindly split every tiny component, though. Excessive splitting can create many small network requests and additional loading overhead.
3. Don't Overuse useMemo and useCallback
useMemo and useCallback are useful React optimization tools, but they're not automatically performance improvements.
For example:
const filteredUsers = useMemo(() => {
  return users.filter(user => user.active);
}, [users]);
Or:
const handleClick = useCallback(() => {
  saveUser(user.id);
}, [user.id]);
These can help when they prevent expensive calculations or unnecessary child renders.
But they also have costs.
React has to:
retain the memoized value or function
track dependencies
compare dependencies during renders
So this:
const value = useMemo(() => a + b, [a, b]);isn't necessarily better than:
const value = a + b;For a trivial calculation, the memoization machinery may provide little or no benefit.
When should you use them?
Consider useMemo when:
a calculation is genuinely expensive
the calculation runs frequently
its dependencies don't change often
profiling shows it matters
Consider useCallback when:
function identity matters to a memoized child
a callback is causing unnecessary child renders
profiling shows the render path is expensive
The better rule
Don't memoize because you can. Memoize because you've measured a problem.
React performance optimization should be driven by evidence, not by adding hooks everywhere.
4. Virtualize Large Lists
Rendering a few dozen items is usually straightforward.
Rendering thousands of DOM elements can become expensive.
Consider a table containing:
10,000 rows
×
10 elements per row
=
100,000 DOM elements
The browser now has a lot more work to do.
This can affect:
rendering
layout
memory usage
scrolling
interaction responsiveness
List virtualization solves this by rendering only the items currently visible in the viewport.
For example, if a user can see approximately 20 rows:
10,000 total rows
┌─────────────────┐
│ Row 4,982       │
│ Row 4,983       │
│ Row 4,984       │
│ ...             │
│ Row 5,001       │
└─────────────────┘
Only visible rows need active DOM elements.
As the user scrolls, the application recycles the rendered items.
Libraries such as react-window and other virtualization solutions can help with this pattern.
When should you consider virtualization?
It becomes particularly useful for:
large tables
chat histories
activity feeds
log viewers
search results
large administrative dashboards
Don't add virtualization to every list. A list of 30 items probably doesn't need it.
5. Optimize Images for Better Loading Performance
Images can easily become some of the largest resources on a web page.
An application can have perfectly optimized JavaScript and still load slowly because it is downloading unnecessarily large images.
Good image optimization involves three things:
Use an appropriate format
Serve an appropriate size
Avoid loading images before they're needed
Modern formats such as WebP and AVIF can reduce image file sizes compared with older formats in many situations.
You should also avoid sending a 3000px-wide image when the browser only needs a 600px-wide version.
For images below the fold, native lazy loading can help:
<img
  src="/images/product.webp"
  alt="Product"
  loading="lazy"
/>
For responsive images, use srcset and sizes where appropriate:
<img
  src="/image-800.webp"
  srcset="
    /image-400.webp 400w,
    /image-800.webp 800w,
    /image-1200.webp 1200w
  "
  sizes="(max-width: 768px) 100vw, 800px"
  alt="Example"
/>
One important exception
Don't blindly lazy-load the image responsible for the initial visible content.
If the main hero image contributes to LCP, delaying it can make the page slower.
Think about images like this
Wrong:
5 MB original image
        ↓
Browser downloads 5 MB
        ↓
Displayed at 600px
Better:
Optimized 600–1200px image
        ↓
Much smaller download
        ↓
Displayed at required size
Image optimization is often one of the first places worth investigating when loading performance is poor.
6. Treat Your JavaScript Bundle as a Budget
Every byte of JavaScript you send to the browser has a cost.
The browser has to:
Download it
Parse it
Compile it
Execute it
This becomes particularly important on slower devices.
That's why you should regularly inspect your production bundle.
For example, you might discover that a small feature pulled in a large dependency:
Application
├── React
├── UI library
├── Date library
├── Chart library
├── Editor
└── Other dependencies
One dependency may be responsible for a surprisingly large portion of the bundle.
Use a bundle analyzer
Depending on your build setup, tools such as bundle analyzers can show which dependencies are contributing to your JavaScript output.
Instead of guessing:
"Maybe React is slow."
You can ask:
"Why is this 400 KB chunk being downloaded on the homepage?"
That's a much better performance question.
Look for
unnecessarily large dependencies
duplicate packages
libraries used for tiny features
dependencies loaded on every route
unused functionality
accidentally imported development code
The bundle isn't just a build artifact.
It's part of your user's performance budget.
7. Make Tree Shaking Work for You
Modern JavaScript bundlers can remove code that your application doesn't use. This process is commonly called tree shaking.
For example, if a library supports named exports:
import { formatDate } from "some-library";your bundler may be able to include only the required code.
But the exact result depends on the package, module format, bundler configuration, and whether the package has side effects.
Why imports matter
Compare the intent of:
import { formatDate } from "some-library";with:
import * as library from "some-library";The first makes your dependency usage more explicit.
However, don't assume that a named import automatically guarantees a tiny bundle. The library's implementation and your bundler still determine the final output.
Also watch for side effects
A package may contain code that must run simply because the module is imported.
That can limit what the bundler can safely remove.
Practical approach
After changing imports, check the generated bundle.
Don't rely on assumptions about what the bundler "should" have removed.
8. Move Heavy Computation Off the Main Thread
The browser's main thread handles important work such as:
JavaScript execution
event handling
layout
rendering
user interactions
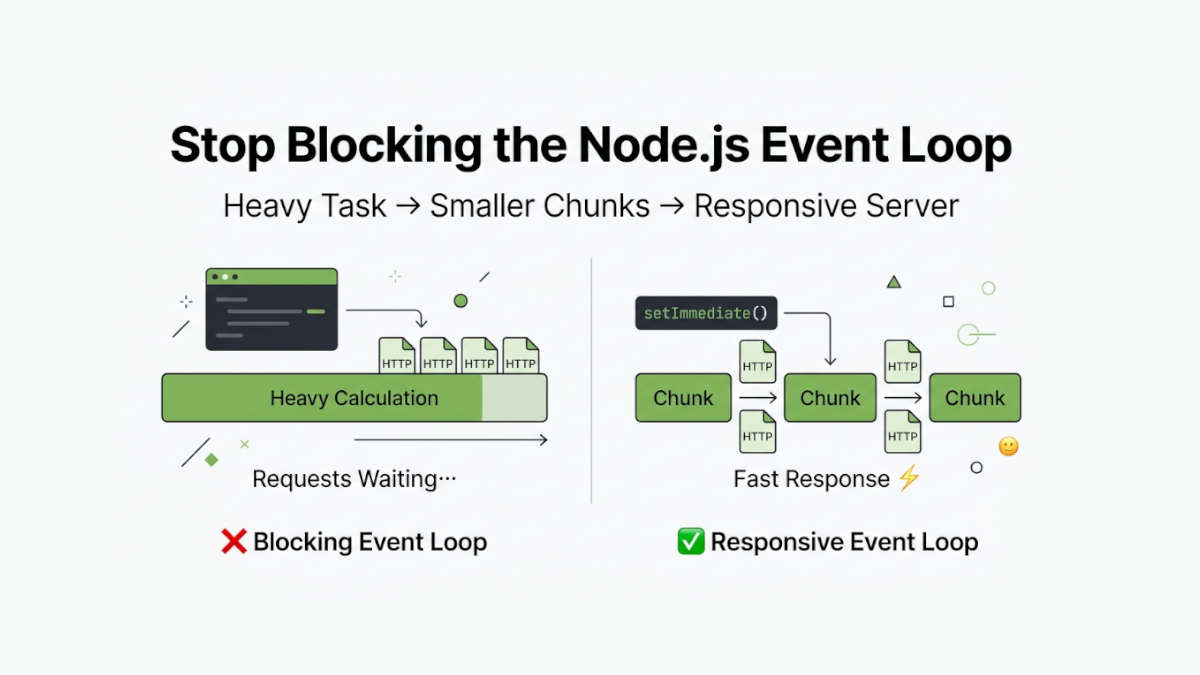
If you run an expensive computation there, the interface can become unresponsive.
For example:
const result = expensiveCalculation(data);If that calculation takes a significant amount of time, clicking buttons or scrolling may feel broken while it runs.
A Web Worker lets you move certain JavaScript work to a separate thread.
Conceptually:
Main Thread
    │
    ├── UI rendering
    ├── User interactions
    └── Web Worker communication
             │
             ↓
       Heavy computation
For example, CPU-heavy tasks such as:
large data transformations
parsing large datasets
complex calculations
certain image processing tasks
may be good candidates.
But don't use workers for everything
Workers introduce communication and data-transfer overhead and have their own complexity.
If a calculation takes a tiny fraction of a millisecond, moving it to a worker won't magically make your application faster.
Again:
Profile first.
9. Debounce and Throttle Expensive Events
Some browser events can fire extremely frequently.
Examples include:
scrollresizemouse movement
search input
pointer events
Imagine a search box that sends an API request for every keystroke:
r
re
rea
reac
react
That's five requests for one search phrase.
Instead, debounce the search.
The basic idea:
User types
   ↓
Wait briefly
   ↓
User still typing?
   ↓
Yes → wait again
No  → perform search
This is useful when you want to wait until the user pauses.
Throttling is different
Throttle limits how often something can run during a period.
For example:
scroll event
↓
run handler
↓
ignore repeated events temporarily
↓
run again
Debounce vs. Throttle
Debounce: Waits until the user stops doing something before running the function. Best for search inputs, form validation, or API requests.
Throttle: Limits how often a function can run while the activity continues. Best for scrolling, resizing, or mouse movement.
Simple way to remember:
Debounce = “Wait until they stop.”
Throttle = “Run at controlled intervals.”
Use debounce for things such as search input and throttle for some continuous events such as scrolling or resizing.
The exact implementation should depend on the interaction you're building.
10. Prefetch Resources When the User Shows Intent
Sometimes you can predict what the user is likely to do next.
For example:
User is browsing product page
          ↓
Moves toward "Reviews"
          ↓
Application starts loading reviews
          ↓
User clicks
          ↓
Content appears faster
This technique is called prefetching.
For a React application with multiple routes, you may preload a route's resources when there is a reasonable signal that the user is about to navigate there.
Potential signals include:
intentional hover
visible navigation elements
links approaching the viewport
a user completing an earlier step in a flow
But be careful
Prefetching isn't free.
It consumes:
network bandwidth
browser resources
potentially battery
Don't preload every route just because you can.
A better strategy is:
Prefetch when the probability of the next action is high enough to justify the cost.
This is particularly useful in applications where navigation between known screens is predictable.
11. Choose SSR, RSC, or CSR Based on the Page
Rendering strategy is another important part of React performance optimization.
There isn't one rendering strategy that is best for every page.
Client-side rendering
With CSR, much of the rendering work happens in the browser.
It's often useful for highly interactive application interfaces.
Examples:
dashboards
complex editors
internal tools
interactive applications
Server-side rendering
With SSR, the server generates HTML for the request, which can help content-heavy pages deliver useful HTML earlier.
This can be useful for:
content pages
product pages
landing pages
pages where initial content matters
React Server Components
RSC provides another way to decide where components and their work should run in frameworks that support the model.
The important point isn't:
"SSR is always faster."
Or:
"CSR is always better."
Instead, think at the page and component level.
Ask:
Does this page need lots of client-side interactivity?
Is the initial content important for the user?
Can some components stay on the server?
How much JavaScript does the browser actually need?
A useful mental model
Content-heavy page
       ↓
Prefer server-oriented rendering where appropriate
Application-heavy page
       ↓
Client-side interactivity may be more important
Modern React applications can also combine approaches rather than choosing one strategy for the entire application.
12. Test React Performance on Realistic Devices
One of the easiest mistakes developers make is testing only on a powerful development machine.
Your development computer might have:
a fast CPU
lots of RAM
a fast SSD
excellent Wi-Fi
a modern browser
Your users may have very different hardware and network conditions.
A React application that feels instant on a powerful laptop can feel noticeably slower on a lower-end mobile device.
Test under constrained conditions
Use browser developer tools to simulate:
slower CPU
slower network
mobile viewport sizes
higher latency
Then test the actual interactions.
Don't only test:
Page loads
✓
Also test:
Click button
→ response time
Open menu
→ response time
Search
→ response time
Scroll large list
→ smoothness
Navigate to another route
→ loading experience
Test production builds
Development builds can behave differently from production builds.
Always measure the application in a realistic production configuration when evaluating performance.
And whenever possible, test real devices
Synthetic testing is useful, but real devices can reveal issues that a desktop simulation doesn't perfectly reproduce.
How These 12 React Performance Techniques Work Together
The techniques above aren't isolated tricks.
They attack different parts of the browser's workload.
Think of a React application like this:
User
 │
 ↓
Network
 │
 ├── HTML
 ├── JavaScript
 ├── CSS
 └── Images
       │
       ↓
Browser
 │
 ├── Download
 ├── Parse
 ├── Execute
 ├── Render
 └── Respond to interactions
Different optimization techniques target different stages:
Too much JavaScript: Code splitting, tree shaking
Large dependencies: Bundle analysis
Slow initial content: Image optimization, SSR/RSC
Slow interactions: Profiling, memoization, Web Workers
Huge lists: List virtualization
Too many event calls: Debounce, throttle
Slow navigation: Prefetching
Layout movement: CLS-focused optimization
Slow mobile experience: Real-device testing
This is why there isn't a single “React performance trick.”
You need to identify where the time is going.
Final Takeaway
React performance optimization isn't about collecting as many optimization tricks as possible.
It's about finding the work that doesn't need to happen—and then reducing, delaying, or moving that work.
Start by measuring Core Web Vitals and profiling real interactions. Then work through the biggest bottlenecks: reduce JavaScript with code splitting and tree shaking, optimize images, virtualize large lists, control expensive events, move heavy computation off the main thread, and use server rendering or prefetching where they actually make sense.
Most importantly, measure before and after every meaningful optimization.
A performance improvement without a measurement is just a hypothesis. A measured improvement is an engineering result.